Query plans
Slow queries are difficult to debug in production. Postgres can generate a query plan for a specific statement, but the exact parameters that caused a bad plan are often unavailable.
PgDog can automatically request and store query plans for slow queries as it serves them. Because plans are fetched in real time, they are more likely to capture the bad execution plan before Postgres autovacuum changes the underlying statistics.
How it works
Query plan collection is disabled by default and can be enabled in pgdog.toml:
The plans are stored in memory and deduplicated by normalized SQL of the query. This means that queries with different parameters will be tied to the same query plan, making sure PgDog doesn't plan the same query multiple times.
Configuration
The query plan cache is configurable:
| Argument | Description | Example |
|---|---|---|
query_plans_threshold |
Minimum query runtime that triggers a query plan (in ms). | 100 |
query_plans_sample_rate |
Percentage of all queries executed through PgDog that will be planned, irrespective of their runtime (between 0.0 and 1.0). | 0.5 |
query_plans_cache |
Maximum number of entries in the in-memory plan cache. | 500 |
query_plans_max_age |
Query plans older than this are considered stale and will be replanned if the query is executed again (in ms). | 15_000 |
Example
Admin database
The query plans are viewable by querying the admin database with the SHOW QUERY_PLANS command:
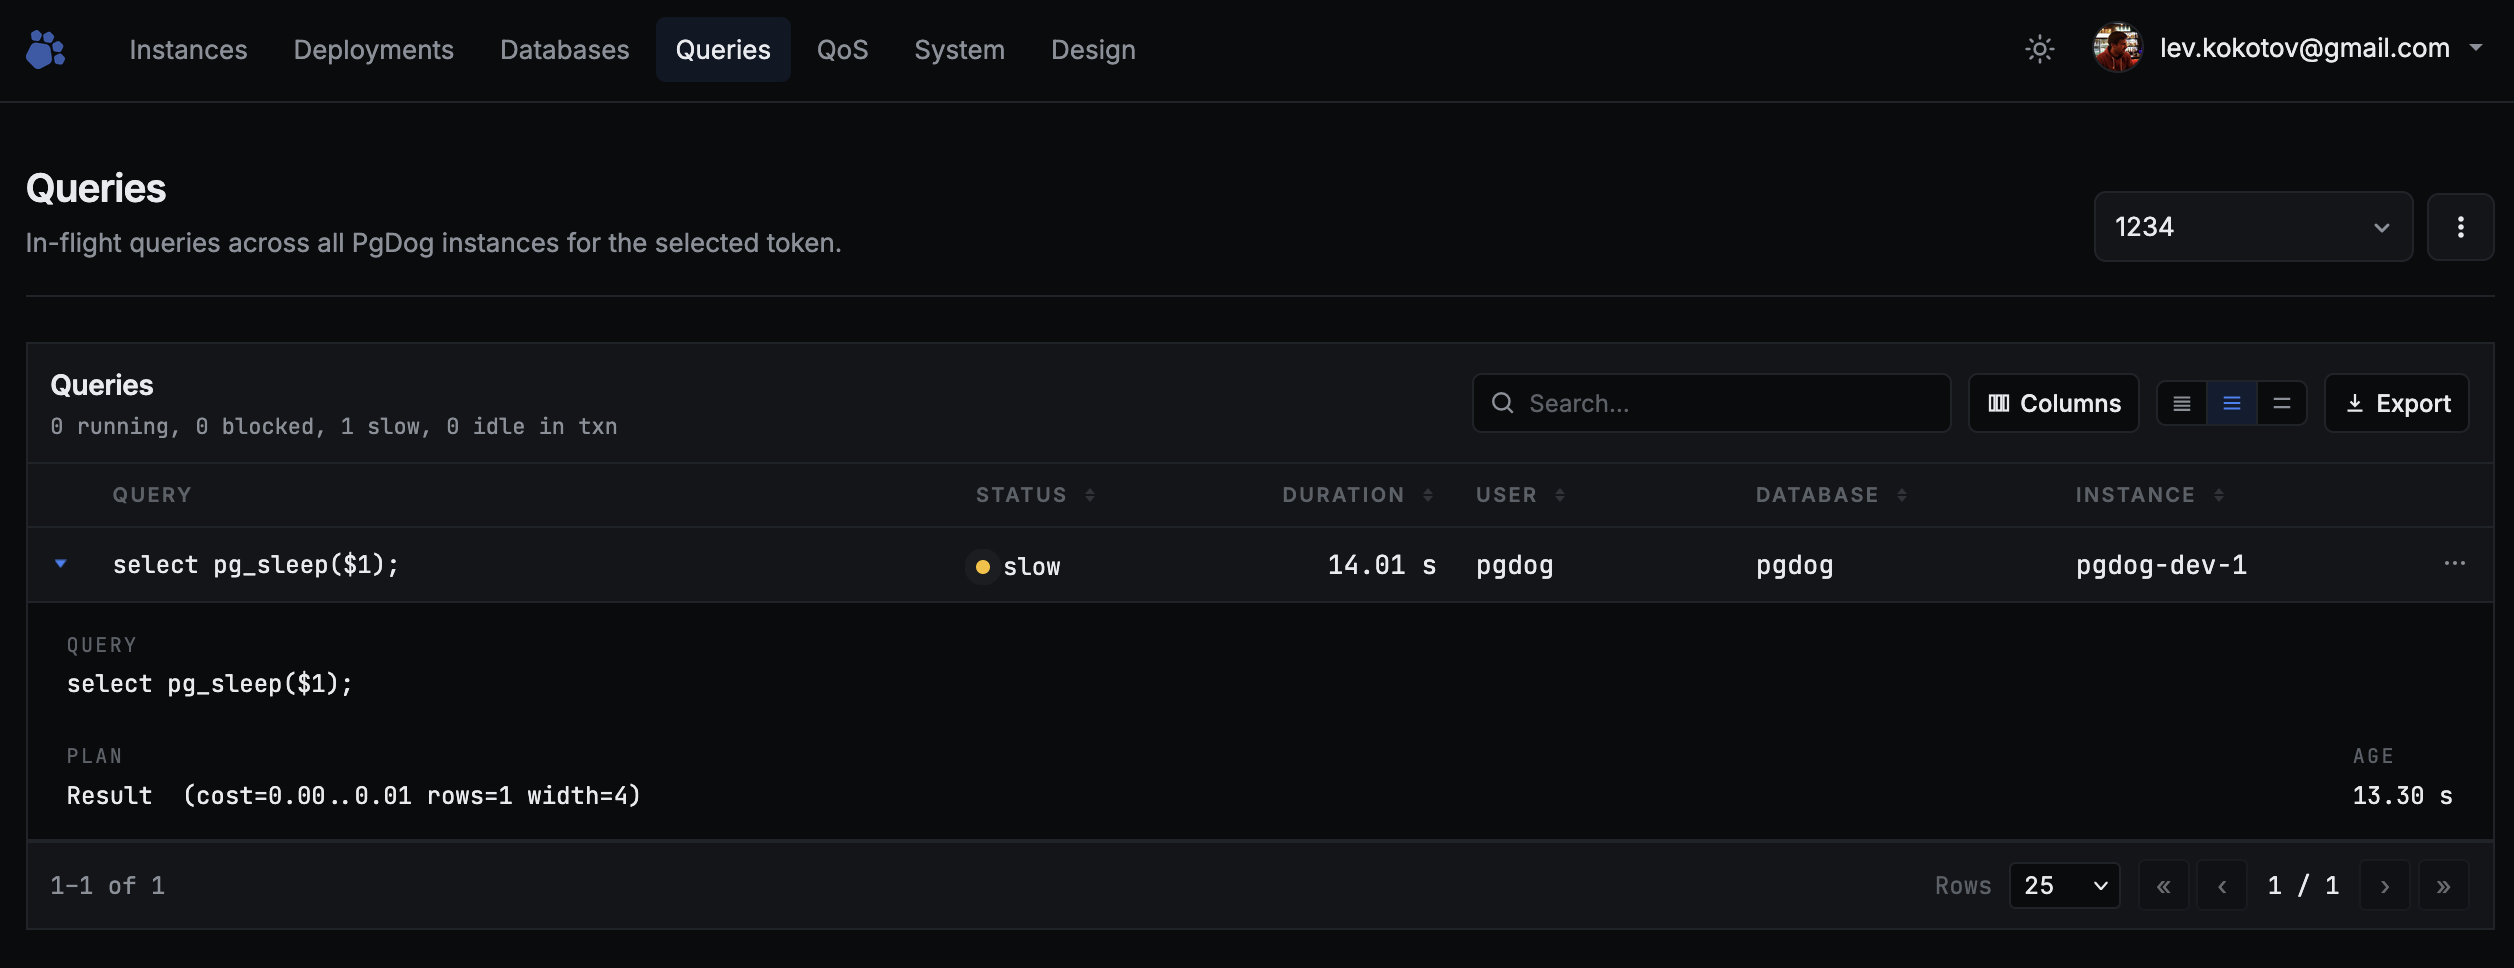
Control plane
The query plans are joined with live queries and are sent to the control plane. They are viewable in the control plane UI and are updated in real time: